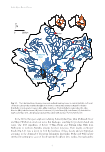
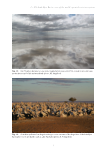
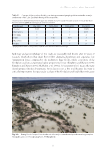
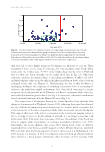
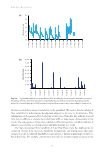
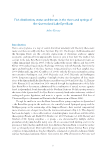
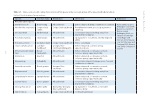
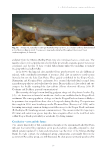
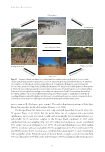
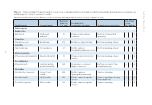
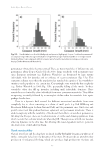
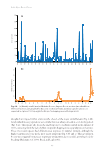
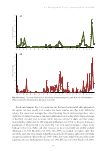
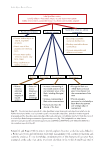
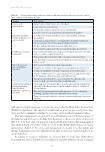
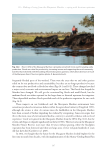
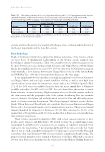
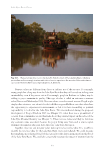
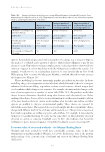
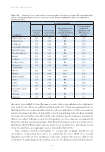
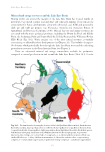
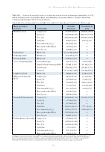
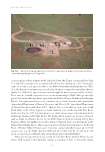
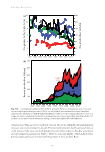
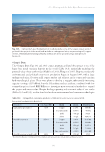
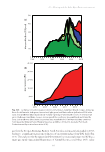
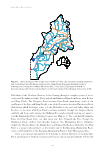
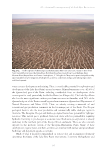
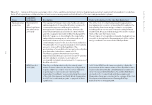
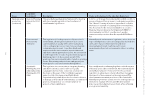
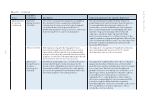
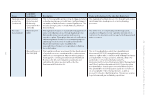
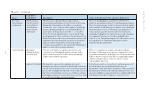
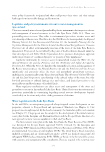
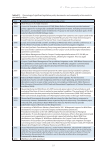
Lake Eyre Basin Rivers 154 and any activities threatening the integrity of landscapes, rivers, wetlands and biodiversity of the Cooper in particular and the Lake Eyre system. Basic hydrology People of the Cooper intuitively recognised the intimate dependence of the system’s ecology on water flows. A fundamental understanding of the Cooper system required some knowledge of annual flow statistics (Table 17.1), available from the only two gauges for the Cooper’s downstream reaches in Queensland, Currareva and Nappa Merrie, with the Nappa Merrie data supplemented for the years 1970–2005 by data from the Cullymurra gauge in South Australia, a short distance downstream. Nappa Merrie is the site of the famous Burke and Wills Dig Tree, ~400 km downstream from Currareva, the other gauge. It was immediately obvious that there were high transmission losses between Currareva and Nappa Merrie and very high annual variability of flow, as well as very high skew introduced into mean values by extreme rare events, such as the 1974 flood period (Table 17.1). If the 1974 event was excluded from the data, the mean annual flow at Currareva would be reduced by ~500 GL or 500 000 ML. For such skewed data, the median is a much better indicator of central tendency. High transmission losses reflect the extreme aridity of the environment and the geographic scale of the system, distributing flow into extensive areas of channels, floodplains and wetlands which receive the flow and effectively prevent much of it from continuing downstream. Three large ungauged tributary systems (Kyabra Creek, Wilson River and Warri Creek) also contribute flow between Currareva and Nappa Merrie and so the measured transmission loss underestimates true loss. The proposed annual demand identified for irrigation for Currareva (47 000 ML), amounted to 19.8% of the median flow at Nappa Merrie and 2.8% of the median flow at Currareva, substantially more than estimates using means. Water volumes measured in megalitres (ML) tend to lack concrete reference to most people, except irrigators and hydrologists. We needed to make the potential impact more meaningful. A useful basis for comparison was to imagine an ‘idealised’ waterhole 60 m wide across the water surface, 5 m unvarying depth and 40 m wide across the bed (bank slope of 1 in 2). Such a waterhole would need to be 4 km long to store 1000 ML. Even such a waterhole 1 km long (holding 250 ML of water) would be a significant drought refuge. The proposed annual irrigation water demand at Currareva would have filled such a waterhole 188 km long. Even more alarming was the evidence from the Murray–Darling Basin that Table 17.1. Descriptive statistics of Cooper Creek annual flows in GL ( = 1000 megalitres), mean, median, standard deviation, coefficient of variation (Coeff. var.) and coefficient of skew (Coeff. skew) at the Currareva and Nappa Merrie gauges, showing the extremely high variability and skew. Gaugea Annual flow (GL) Coeff. var. Coeff. skew Mean Median Std. dev. Currareva 3150 1690 4260 1.35 3.08 Nappa Merrie 1430 240 2890 2.02 3.37 a https://water-monitoring.information.qld.gov.au and McMahon et al. (2008) , Currareva records 1939–1988 (incomplete), Nappa Merrie records 1949–2005 (incomplete)
Downloaded from CSIRO with access from  at 216.73.216.88 on Nov 13, 2025, 5:04 AM.
(c)  CSIRO Publishing