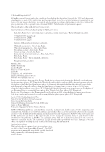
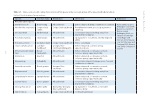
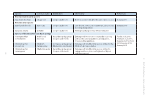
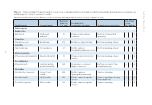
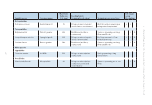
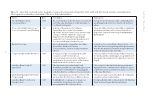
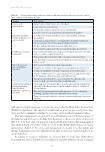
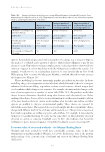
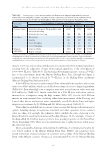
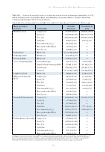
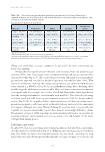
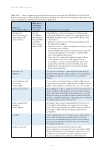
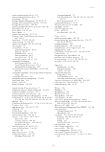
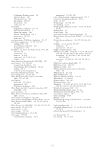
19 – Mining and the Lake Eyre Basin environment 175 Table 19.1. Volumes of available resources and production of mineral and energy commodities in 2013, within and adjacent to the Lake Eyre Basin, including the proportions relative to available Australian resources and annual production in parentheses. Units include tonnes (t), thousand tonnes (kt), million tonnes (Mt), million litres (ML), and peta (1015) joules (PJ) for energy. Major geological province Commodity Available Resources Production in 2013 Mount Isa Block Copper (Cu) 16.11 Mt (11.6%) 248.4 kt (24.9%) Lead (Pb) 29.60 Mt (50.4%) 431.1 kt (60.6%) Zinc (Zn) 46.52 Mt (79.2%) 956.7 kt (62.8%) Gold (Au) 418.6 t (2.8%) 6.88 t (2.6%) Uranium oxide (U 3 O 8 ) 103.9 kt (3.0%) 0 Rare earth oxides (REOs) 0.90 Mt (1.5%) 0 Iron (Fe) ore 328 Mt (0.2%) 0 Galilee Basin Black coal 35 300 Mt (20.8%) 0 Arckaringa Basin Brown coal 11 131 Mt (4.9%) 0 Eromanga Basin Black coal 5941 Mt (3.5%) 0 Cooper-Eromanga Basin Conventional gas 1906 PJ (1.7%) 109 PJ (4.9%) Liquefied petroleum gas (LPG) 503 ML (0.3%) 353 ML (3.2%) Condensate 5243 ML (1.7%) 250 ML (3.5%) Crude oil 16 014 ML (11.8%) 1916 ML (17.6%) Leigh Creek Field Black coal 546 Mt (0.3%) 3.2 Mt (0.5%) Willyama (Broken Hill) Block Copper (Cu) 0.47 Mt (0.3%) 4.0 kt (0.4%) Lead (Pb) 2.37 Mt (4.0%) 51.4 kt (7.2) Zinc (Zn) 3.09 Mt (5.3%) 64.2 kt (4.2%) Gold (Au) 30.5 t (0.2%) 2.05 t (0.8%) Uranium oxide (U 3 O 8 ) 90.3 kt (2.6%) ~300 t (4.7%) Rare earth oxides (REOs) 0.05 Mt (0.1%) 0 Iron (Fe) ore 1985 Mt (1.5%) 0 Stuart Shelf (and nearby) Copper (Cu) 85.08 Mt (61.2%) 252.0 kt (25.2%) Lead (Pb) 0.21 Mt (0.4%) 0 Zinc (Zn) 0.21 Mt (0.4%) 0 Gold (Au) 3566.9 t (24.2%) 7.71 t (2.9%) Uranium oxide (U 3 O 8 ) 2654 kt (77.0%) 4024 t (62.6%) Rare earth oxides (REOs) 52.67 Mt (90.5%) 0 Iron (Fe) ore 586 Mt (0.4%) 0 Pedirka Basin (and nearby) Copper (Cu) 0.35 Mt (0.3%) 0 Lead (Pb) 0.026 Mt (0.04%) 0 Zinc (Zn) 0.022 Mt (0.04%) 0 Gold (Au) 3.2 t (0.02%) 0 Uranium oxide (U 3 O 8 ) 23.5 kt (0.4%) 0 Rare earth oxides (REOs) 1.22 Mt (2.1%) 0 All mineral resources estimates compiled from company reporting production data compiled from Australian Bureau of Resource and Energy Economics (2014) Geoscience Australia (2014) Mudd (2014) Office of the Chief Economist (2014) Australian Petroleum Production and Exploration Association (2015) United States Geological Survey (2015).
Downloaded from CSIRO with access from  at 216.73.216.128 on Nov 9, 2025, 7:57 AM.
(c)  CSIRO Publishing