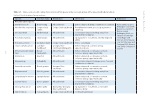
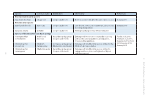
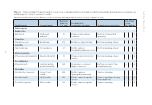
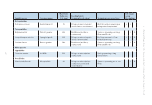
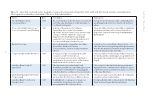
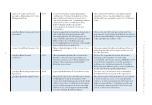
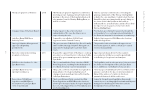
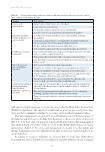
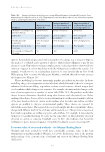
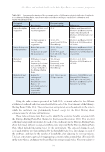
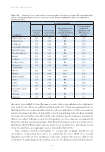
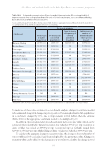
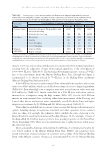
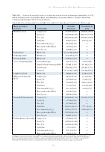
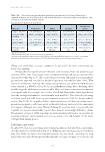
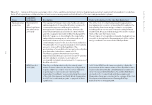
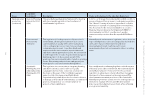
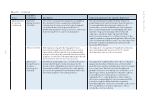
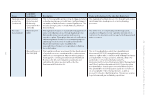
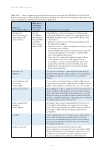
Lake Eyre Basin Rivers 164 the survey were unlikely to have the same economic value as respondents and so adjustments were made for this (Morrison and Hatton-Macdonald 2010). Values were aggregated only for the Murray River, across Australian households in all states and territories. However, sensitivity analysis determined the effects of either fully or partly extrapolating values for these wetlands, to households outside their state. Most of the value estimates were for single-year payments. In the few cases where willingness to pay involved payment over more than one year, amounts in later years were discounted and summed. This allowed an estimation of non-use values across the Murray–Darling Basin and produced a range of non-use values for a unit change in each of the four attributes, after aggregation across households (Table 18.4). Such estimates allowed policy-makers to consider the economic benefit for the environment, of providing more water (i.e. improving the rivers which were seriously degraded), across the 19 river catchments. Each value estimated the non-use value for the community of a unit change in the attribute, such as a 1% change in native fish populations. Table 18.3. Estimates of economic values in dollars per household (present value, NA = not applicable) of four ecological attributes of the 19 catchments in the Murray–Darling Basin (Morrison and Hatton- MacDonald 2010). Catchment Ecological attribute 1% increase in native vegetation 1% increase in native fish populations One-year increase in frequency of colonial waterbird breeding Unit increase in number of waterbirds and other species present Barwon–Darling 2.26 0.46 13.87 2.25 Border Rivers 2.19 0.46 NA 1.10 Campaspe 5.69 5.06 NA 3.89 Condamine–Balonne 2.63 0.46 13.87 1.10 Mt Lofty Ranges 5.69 5.06 NA 3.89 Goulburn–Broken 5.69 5.06 NA 3.89 Gwydir 2.19 0.46 13.87 1.10 Lachlan 2.19 0.46 13.87 1.10 Loddon–Avoca 5.69 5.06 NA 3.89 Macquarie– Castlereagh 2.19 0.46 33.08 1.10 Moonie 2.63 0.46 13.87 1.10 Murray 13.72 12.80 65.11 3.43 Murrumbidgee 2.26 0.46 13.87 2.25 Namoi 2.19 0.46 NA 1.10 Ovens 5.69 5.06 NA 3.89 Paroo 2.63 0.46 13.87 1.10 Snowy Mountains Scheme NA NA NA NA Warrego 2.63 0.46 NA 1.10 Wimmera 2.19 0.46 NA 1.10
Downloaded from CSIRO with access from  at 216.73.216.88 on Nov 13, 2025, 2:31 AM.
(c)  CSIRO Publishing