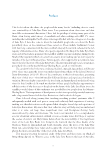
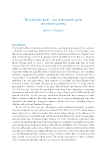
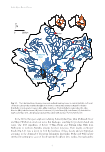
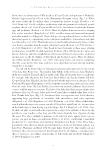
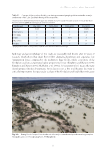
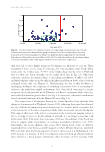
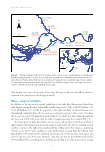
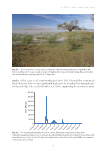
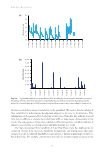
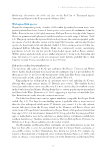
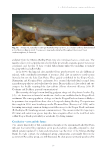
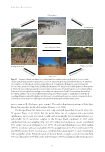
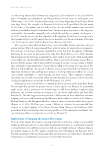
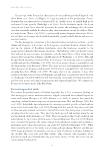
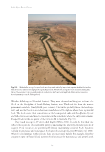
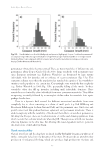
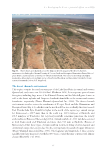
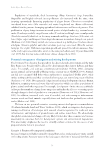
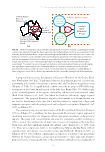
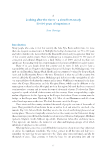
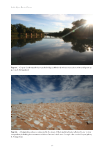
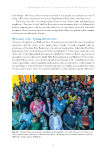
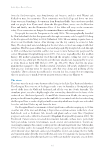
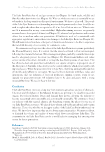
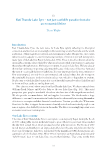
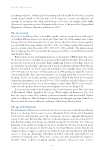
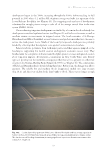
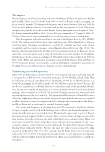
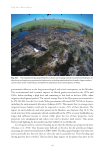
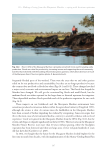
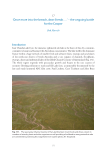
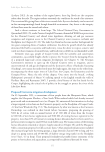
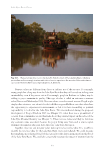
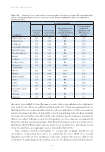
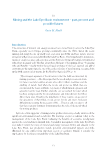
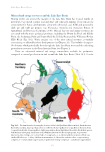
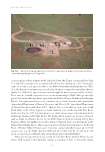
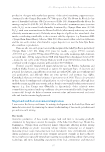
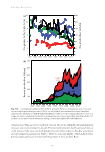
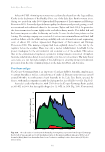
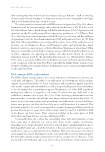
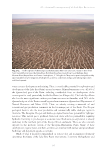
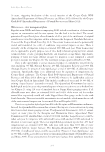
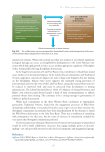
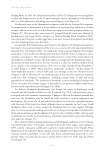
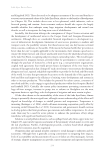
Lake Eyre Basin Rivers 22 their livestock on these highly productive floodplains (see Chapters 10 and 11). These ‘transmission losses’ can be huge. For instance, for some medium-volume floods which return every one to three years, 90–95% of the volume that passes the town of Windorah does not flow into South Australia (see the circled flood data in Fig. 2.3). This water evaporates, infiltrates the channel (where it can recharge groundwater Cendón et al. 2010) and the floodplain, or lies on the floodplains (Knighton and Nanson 1994), where it fuels an ecological boom cycle (see Chapter 1). Understanding the fate of this floodwater is challenging. Adding to the complexity of estimating transmission losses is accounting for inflows to the reach from rainfall and tributary flow. Some flood events may be entirely composed of run-off generated in the Thomson and Barcoo catchments while others (e.g. those with flow fractions greater than 0.3 in Fig. 2.3) can receive substantial contributions from local rainfall and run-off in the Channel Country (Fig. 2.4). The composition of floodwaters flowing into South Australia shows relatively little change to that measured at Windorah (Larsen 2012), indicating that some flow channels are very efficient in transporting water downstream (i.e. without much evaporative loss and concentration of the ionic composition) while others move water onto the floodplain. This suggests that most of the water loss measured at the downstream gauging station is due to pooling of water on the floodplain or wetlands (i.e. no longer connecting with downstream flow). This water then evaporates, infiltrates the sediment of the floodplain where it supplies plant transpiration, or recharges groundwater (Cendón et al. 2010). Surprisingly, the actual channels that convey flow during flood events of different magnitudes have never been accurately mapped nor their different functions identified. This is an important knowledge gap and a focus for our research (e.g. Mohammadi et al. 2017) because, for instance, if there was irrigation extraction from an efficient pathway, there would be a much greater downstream effect (in terms of flow reaching South 0.0 0.2 0.4 0.6 0.8 1.0 10 000 100 000 1 000 000 10 000 000 100 000 000 Flow event (ML) Fig. 2.3. Fraction of flow in the Channel Country of Cooper Creek reaching the border of South Australia (measured at the Nappa Merrie gauge), relative to total flood event volume (log scale) measured at the Currareva gauge (near Windorah). Daily flow data supplied by the Queensland Department of Natural Resources and Mines (1950–88). The dashed oval shows the medium volume floods that experience some of the highest relative volume reductions in this reach. Fracti of fl
Downloaded from CSIRO with access from  at 216.73.216.131 on Nov 19, 2025, 11:00 AM.
(c)  CSIRO Publishing