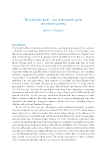
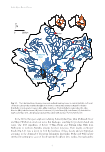
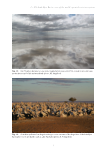
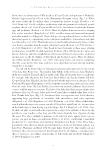
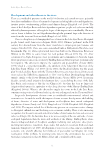
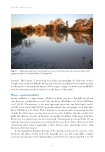
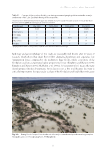
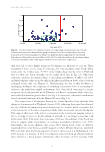
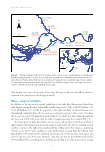
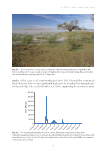
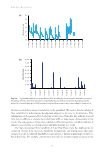
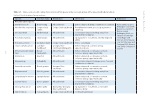
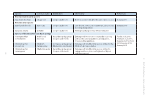
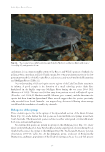
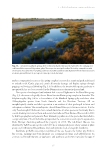
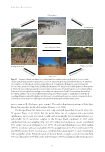
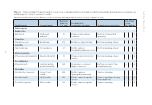
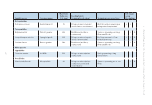
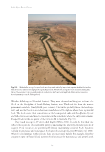
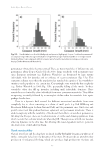
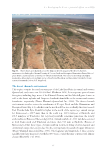
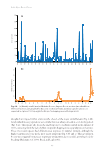
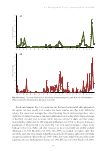
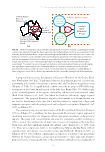
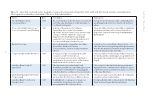
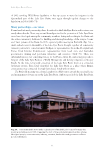
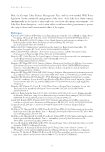
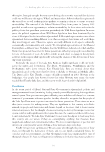
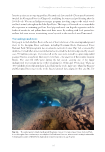
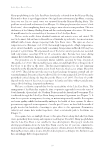
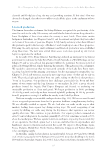
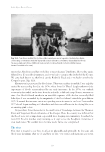
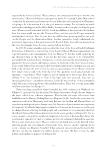
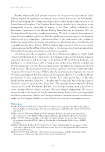
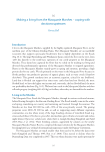
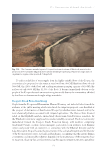
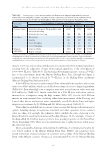
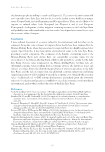
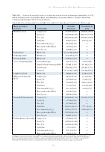
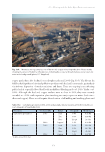
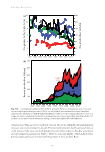
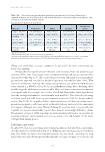
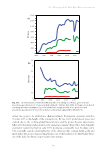
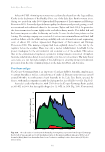
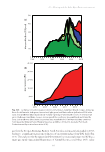
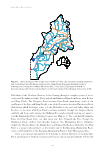
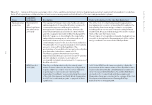
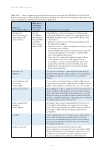
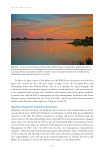
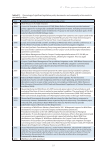
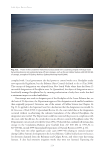
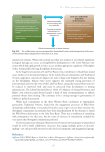
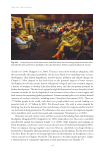
Lake Eyre Basin Rivers 24 flow between the major flow paths of the lower Cooper are known, we will be unable to represent this behaviour in a hydrological model. When – temporal variability In addition to the spectacular spatial variability of the Lake Eyre Basin rivers, their flows rank highest among the most temporally variable large rivers of the world (Puckridge et al. 1998 McMahon et al. 2008b). In particular, this high variability in flows between years (interannual variability) drives the boom–bust ecological response to flow events. Very large floods (e.g. those in 2010) inundated greater than 10 000 km2, but this shrinks in relatively dry years (e.g. 2013), with more than an order of magnitude lesser flow volume (Fig. 2.7). For many parts of Lake Eyre Basin, we have no records of when rivers flowed. There is improvement with expansion of the monitoring network (Table 2.1), but the available records are short, relative to the high interannual variability of these rivers. For instance, monitoring of flows in the 34 000 km2 catchment of the Neales River (western Lake Eyre Basin) from March 2000 to November 2009 identified an average of 2.5 flows per year, with one or two flows in any one reach of the river. However, there were another 22 flows between November 2009 and April 2011, coinciding with a La Niña episode (Fig. 2.8a). This increased the average 40 km Cooper Creek Innamincka Strzelecki Creek 3 Coongie Lakes Northwest Branch Main Branch 5 km Cooper Creek North-west Branch Main Branch Apr 2011 5400 ML/day (34%) Apr 2012 1500 ML/day (20%) Apr 2012 2000 ML/day Apr 2012 4000 ML/day Apr 2011 16 000 ML/day Apr 2012 7500 ML/day Fig. 2.5. Changes in flow volume in 2011 and 2012 at the split in Cooper Creek between the North-west Branch (flowing towards Coongie Lakes) and the two channels of the Main Branch (flowing towards Lake Eyre). The inset figure shows the lower Cooper where it changes from an anastomosing channel system to a distributary system downstream of Innamincka. The shaded rectangle in the inset figure shows the location of the North-west Branch and Main Branch split.
Downloaded from CSIRO with access from  at 216.73.216.187 on Nov 17, 2025, 3:46 PM.
(c)  CSIRO Publishing