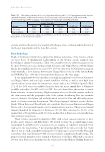
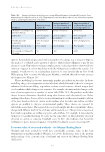
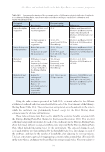
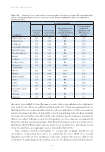
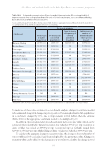
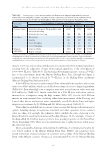
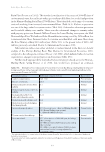
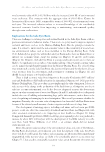
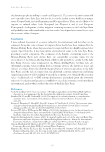
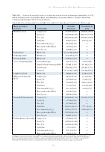
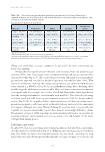
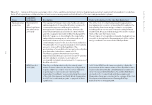
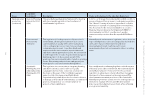
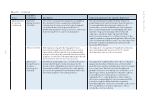
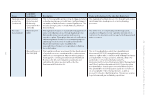
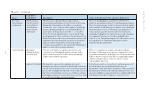
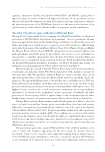
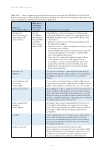
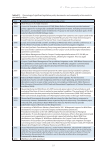
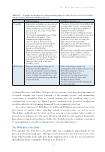
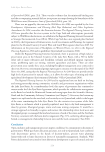
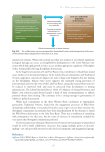
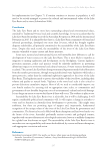
18 – River and wetland health in the Lake Eyre Basin – an economic perspective 165 To make use of these value estimates in a cost–benefit analysis, changes in attributes needed to be estimated, along with changes in policy position. For example, if native fish populations in a catchment changed by 10%, due to improvements in fish habitat, then the estimate (Table 18.4) for the appropriate catchment needed to be multiplied by 10. In addition, the recreation values in each catchment have economic value, which can be estimated where identifiable. General recreation was valued at $55.40 per trip recreation at dams or lakes was valued at $35.98 per trip recreational trips at wetlands ranged from $270.13 to $561.28 per trip while fishing at dams or lakes was valued at $355.90 per trip. To calculate the aggregate change in recreation value, the change in the total number of visits would need to be calculated and then multiplied by the appropriate value. Changes in recreation value can be added to the change in non-use values to calculate the change in total Table 18.4. Estimated economic values ($) per household (present value, NA = not applicable) of improvements in four ecological attributes for each of 19 river catchments, across the Murray–Darling Basin (Morrison and Hatton-Macdonald 2010). For all catchments apart from the River Murray, values (Table 18.3) were aggregated across all households in the state where the catchment was located (with an adjustment for non-respondents). Catchment Ecological attribute 1% increase in native vegetation 1% increase in native fish populations 1 year increase in frequency of colonial waterbird breeding Unit increase in number of waterbirds and other species present Barwon–Darling $3 594 000 $667 000 $24 693 000 $3 578 000 Border Rivers $2 437 000 $414 000 NA $1 086 000 Campaspe $3 363 000 $2 990 000 NA $2 299 000 Condamine–Balonne $2 926 000 $414 000 $15 337 000 $1 086 000 Mt Lofty Ranges $1 494 000 $1 329 000 NA $1 022 000 Goulburn–Broken $5 019 000 $4 463 000 NA $3 431 000 Gwydir $3 482 000 $667 000 $24 693 000 $1 749 000 Lachlan $3 482 000 $667 000 $24 693 000 $1 749 000 Loddon–Avoca $3 363 000 $2 990 000 NA $2 299 000 Macquarie-Castlereagh $3 482 000 $667 000 $58 802 000 $1 749 000 Moonie $1 961 000 $277 000 NA $728 000 Murraya $79 098 000 $73 794 000 $375 369 000 $12 203 000 Murrumbidgee $3 594 000 $667 000 $24 693 000 $3 578 000 Namoi $3 482 000 $667 000 NA $1 749 000 Ovens $3 363 000 $2 990 000 NA $2 299 000 Paroo $2 598 000 $414 000 $15 337 000 $1 086 000 Snowy Mountains Scheme NA NA NA NA Warrego $2 598 000 $414 000 NA $1 086 000 Wimmera $2 660 000 $509 000 NA $1 336 000 a Values from Table 18.3 were aggregated across all Australian households (with an adjustment for non-respondents).
Downloaded from CSIRO with access from  at 216.73.216.172 on Nov 24, 2025, 10:25 PM.
(c)  CSIRO Publishing


