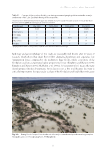
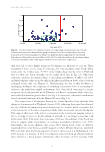
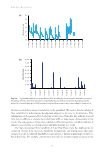
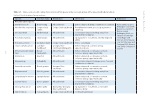
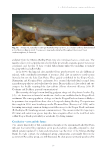
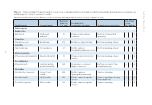
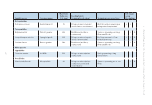
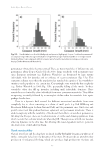
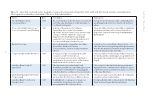
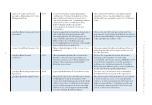
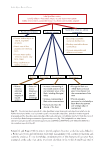
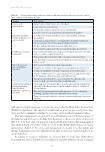
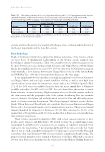
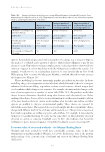
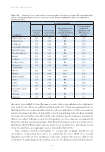
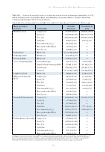
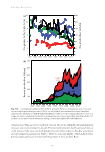
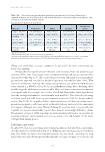
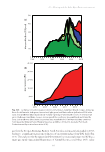
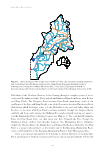
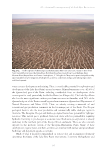
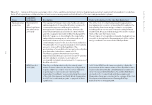
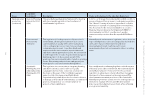
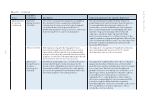
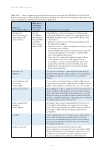
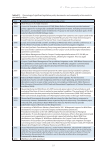
18 – River and wetland health in the Lake Eyre Basin – an economic perspective 167 increase in non-use and use values and decreases in economic value from irrigated agriculture, resulting from the redirection of water from irrigated agriculture to the environment of 3000–4000 GL/year (Table 18.5). The Australian Government agreed to return 2750 GL/ year to the environment under the Murray–Darling Basin Plan, although this figure is recommended to be further reduced by 70 GL/year in the Darling River catchments (Murray–Darling Basin Authority 2016). A 3000 GL/year increase in environmental flows substantially increased use and non-use values (over $3300 million), which exceeded the lower estimate for costs to irrigated agriculture (Table 18.5). Even when high costs to irrigation were used, use and non-use values were only $145 million less (Table 18.5). Similar results held for a 3500 GL/year reallocation, with an increased cost to irrigation, using the high estimate (Table 18.5). For the 4000 GL/year increase in environmental flows, including values from improvement of the Coorong and Lower Lakes, the use and non-use values substantially exceeded both the lower and higher irrigation cost estimates, by $9.1 billion and $3.1 billion respectively (Table 18.5). This evaluation excluded various non-use values associated with improved environmental quality, including changes in vegetation, waterbirds and other organisms. It also excluded other use values. For example, the evaluation did not include the value of grazing to the livestock industry, resulting from increased flooding (Chapter 11). For example, 15 years of flooding added $6.8 million in gross profit to three grazing properties on the Paroo River (Arche Consulting 2010). There were also insufficient data to apply this more widely across the entire river basin. Given considerable challenges in identifying the full range of environmental benefits for cost–benefit analysis of the Murray–Darling Basin Plan, CSIRO and researchers from several universities evaluated changes in ecosystem service values of the Murray–Darling Basin, with different scenarios of increased environmental flows for the Murray–Darling Table 18.5. Increases in non-use and use values and decreases in irrigated agricultural economic values (NA = not available), for three scenarios of water returned to the environment, evaluated in the cost–benefit analysis for the Murray–Darling Basin Plan (Centre for International Economics 2011). Economic value Cost ($x million) of environmental flow scenarios 3000 GL 3500 GL 4000 GL Non-use values Values for changes in fish population and waterbird breeding $3750 $4760 $5430 Values for the Coorong NA NA $4274 Use values Recreation $490 $562 $649 Salinity $91 $87 $84 Cost of flooding $2 $2 $2 Cost of dredging $13 $14 $14 Irrigated agriculturea Lower estimate $924 $1107 $1309 Higher estimate $4491 $5789 $7329 a Lower cost estimates resulted from assuming and elasticity of demand of -0.5 for water (i.e. more elastic, so reduced water availability had less effect on water prices) and there was no baseline growth in the real price of water. High cost estimates resulted from assuming that there was an elasticity of demand for water of -0.05 (i.e. more inelastic demand, so reduced water availability had an increased effect on water prices) and that the baseline real price of water grew by at ~8%/year.
Downloaded from CSIRO with access from  at 216.73.216.88 on Nov 13, 2025, 8:59 AM.
(c)  CSIRO Publishing