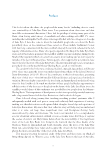
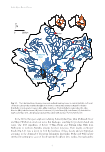
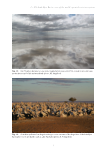
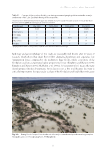
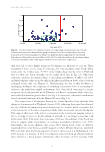
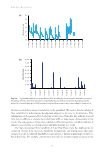
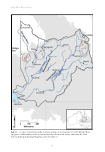
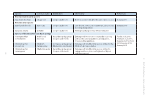
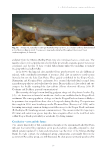
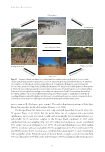
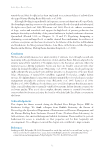
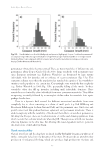
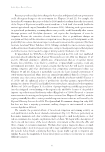
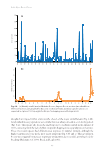
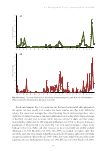
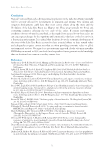
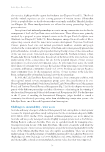
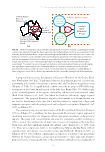
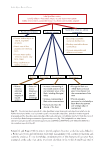
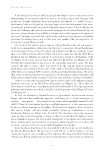
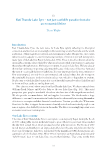
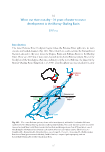
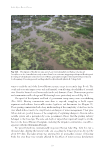
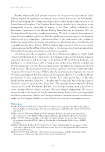
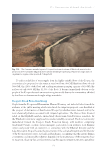
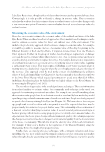
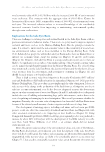
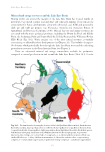
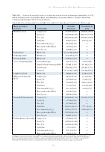
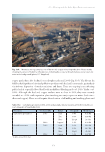
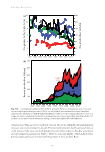
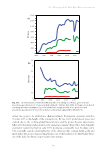
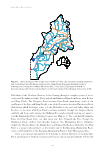
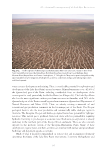
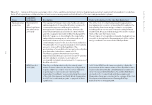
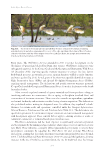
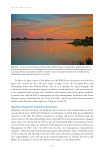
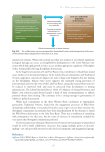
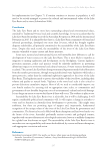
Lake Eyre Basin Rivers 184 At least 447 ML of mining waste water was accidentally released into the Saga and Inca Creeks in the headwaters of the Buckley River, one of the Lake Eyre Basin’s western rivers, during two periods in early 2009 (Queensland Department of Environment and Heritage Protection 2012). It severely degraded water quality, biodiversity and pastoral grazing, as well as recreational and traditional values for the streams (Taylor and Little 2013). In particular, the downstream river became highly acidic and rich in heavy metals. This killed fish and had severe impacts on other biodiversity and cattle. It even dissolved star pickets used in fencing. The mining company was convicted of serious environmental harm and fined half a million dollars, with the additional responsibility and costs of remediation and engineering costs of almost $11 million (Queensland Department of Environment and Heritage Protection 2012). The mining company had been explicitly alerted to this risk by the regulator before the accident. There was only a modest ‘rehabilitation’ bond held for the project, inadequate for the environmental and economic cost of the accident. This serious flaw in the environmental regulatory system for mining remains unresolved throughout Australia: rehabilitation bonds do not currently cover the costs of accidents. The Lady Annie case stands as a rare but stark example of the challenges in achieving strong environmental protection from the risks of mining impacts in the Lake Eyre Basin and Australia. Petroleum and gas The Cooper–Eromanga Basin is an important oil and gas field for Australia, supplying gas to eastern Australia as well as a critical source of crude oil. Primary operations are centred around Moomba in north-eastern South Australia in the Lake Eyre Basin, operated by Santos, with smaller companies recently developing modest size oil fields (or wells) (Fig. 19.2). Australia’s crude oil production, with 17.6% from the Cooper–Eromanga Basin, peaked at 34.0 GL in 2000, but has rapidly dropped to 12.6 GL in 2014 (Fig. 19.8). Conventional 0 6 12 18 24 30 36 1968 1978 1988 1998 2008 Fig. 19.8. Annual crude oil production in Australia, showing the proportion from Cooper–Eromanga Basin (red) of Queensland and South Australia, relative to the Gippsland Basin (green) and the rest of Australia (blue) (data from Australian Petroleum Production and Exploration Association (2015) GL – billion litres). Crude oil production (GL/y )
Downloaded from CSIRO with access from  at 216.73.216.152 on Nov 28, 2025, 11:59 AM.
(c)  CSIRO Publishing