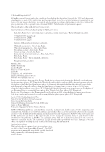
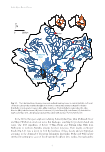
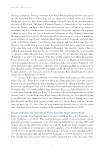
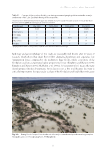
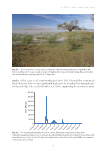
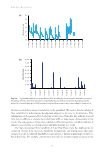
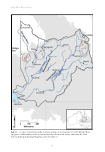
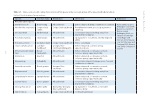
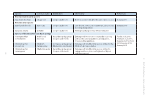
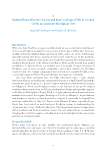
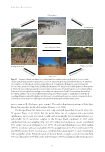
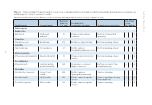
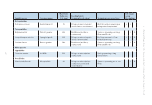
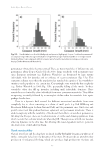
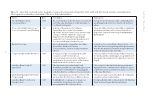
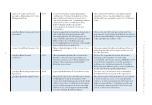
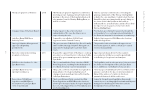
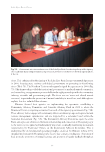
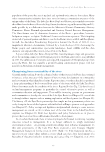
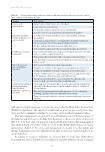
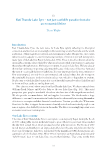
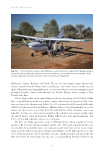
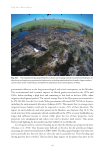
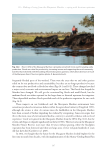
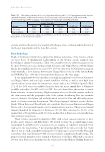
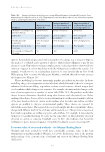
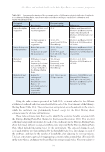
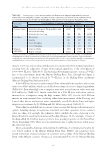
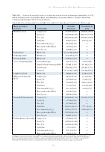
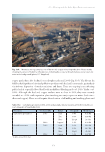
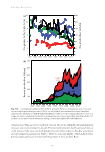
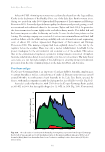
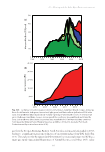
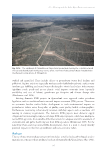
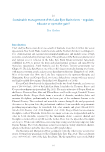
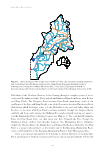
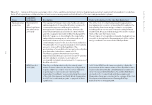
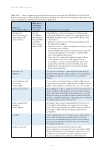
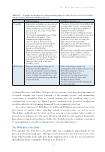
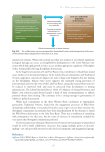
Lake Eyre Basin Rivers 182 (Weng et al. 2013), these resources continue to be ignored for the more controversial and lower value uranium. Olympic Dam has significant environmental costs in energy, water and greenhouse gas emissions (Table 19.4). Total energy, water consumption and greenhouse gas emissions have increased over time (Fig. 19.7). The overall efficiency of water and energy use and greenhouse gas emissions improved over the first decade of operations, but stabilised after ~2002. With respect to production of metals, the energy and greenhouse gas emissions intensities per tonne of metal (e.g. GJ/t Cu, t CO 2 /t U 3 O 8 ) are gradually increasing, due to declining, albeit variable ore grades, while water use remains stable. Major accidents can increase environmental costs significantly. For example, the October 2009 Clark Shaft failure limited production from the underground mine for several months until mid-2010. This reduced total energy and water needs but still drove up environmental metrics in 2009–10, despite reduced activity (Fig. 19.7b). As ore grades decline, significant pressure will drive up energy–water– greenhouse gas metrics, with fewer metals produced from lower grade ore for the same inputs and outputs. Although the former Western Mining Corporation used to report such data regularly in corporate sustainability reports, these data are increasingly difficult to obtain. Transparency and good public reporting on environmental performance are essential for assessing long-term environmental and socio-economic costs and benefits of the major Olympic Dam mining project. Lady Annie copper mine In early 2009, there was a very large environmental accident at the Lady Annie copper mine, ~200 km north-west of Mount Isa (Fig. 19.1). While the open cut mines are just outside the Lake Eyre Basin, the main processing infrastructure was just inside, consisting of a heap leach which uses acid solutions passing through piles (or heaps) of copper ore to dissolve and Table 19.4. Production, energy, water and greenhouse gas emissions for Olympic Dam (mean ± standard deviation, 2009–2013), based on each metal’s proportional financial value, in parentheses, and average annual inputs divided by outputs. Data updated from Mudd (2009) Mudd (2014). Measure Production Water Energya Greenhouse gasesb Copper (75.27%) 170 ± 39 kt/year 47.1 ± 5.5 kL/t 21.8 ± 4.6 GJ/t 3.8 ± 0.1 t CO 2 /t Uranium oxide (17.54%) 3650 ± 775 t/year 528 ± 43 kL/t 249 ± 39 GJ/t 44.0 ± 2.9 t CO 2 /t Gold (6.25%) 3.21 ± 0.66 t/year 271 ± 17 ML/t 125 ± 17 PJ/t 22.6 ± 1.1 kt CO 2 /t Silver (0.94%) 29.16 ± 6.05 t/ year 4.4 ± 0.4 ML/t 2.0 ± 0.4 PJ/t 0.36 ± 0.006 kt CO 2 /t Average inputs/ outputsc 11 100 ± 1750 ML/year 5.63 ± 0.93 PJ/ year 951 ± 53 kt CO 2 / year a giga (109) joules (GJ) b Greenhouse gas emissions are carbon dioxide (CO 2 ) equivalent. c Average inputs divided by outputs refers to taking inputs (e.g. water) divided by outputs such as copper, based on the proportional financial value of that output (e.g. 75.27% of total input water is allocated to producing copper).
Downloaded from CSIRO with access from  at 216.73.216.88 on Nov 13, 2025, 2:31 AM.
(c)  CSIRO Publishing